
Description
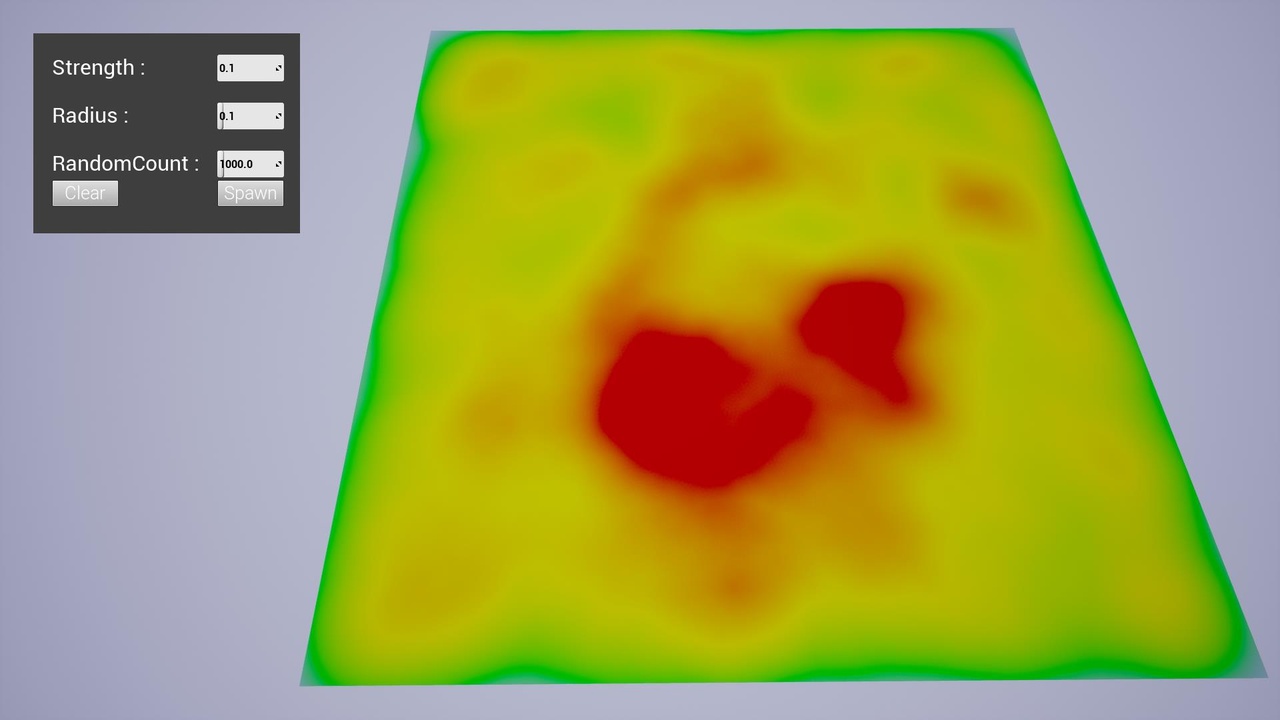
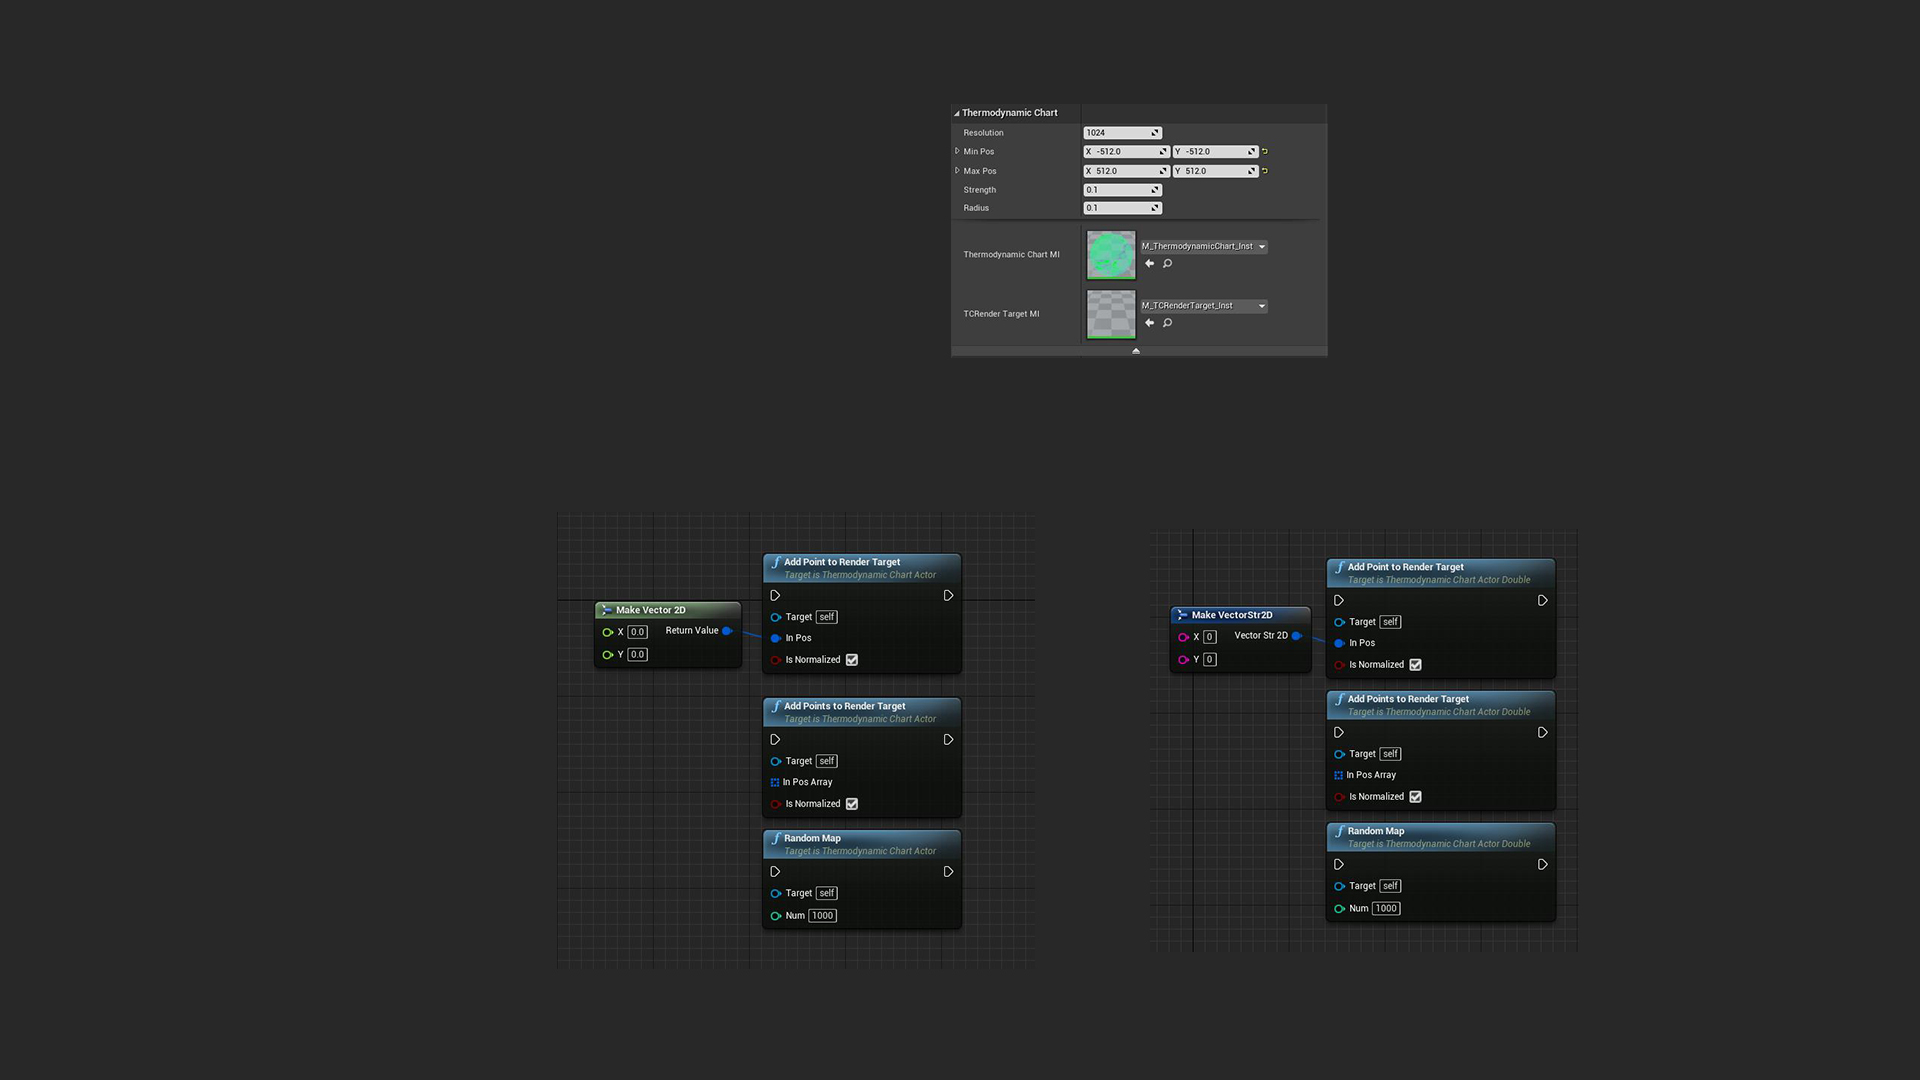
When we set the maximum and minimum interval, and then add data points to the middle, the more data points at this location, the more obvious the color changes.
Generate heat maps based on data.
Simple and easy to use!
Support high-precision data (e.g latitude and longitude data).
Open the Content Browser window, in the upper right corner of the Content Browser, click the Settings button, This will open a menu where you can adjust various settings for the current instance of the Content Browser, Under the View category, check the Show Plugin Content option, Find the Thermodynamic Chart->Content->Thermodynamic Chart directory, There are sample levels and related assets inside.
Change log : (2021/05)
Add the option of fitting to the ground. (Pending Approval )
Change log : (2021/02)
Support 4.25 version
You can contact us at any time and request that the asset you want be added to the site from the Request Asset section.